 Salt Lake County & Code for America, 2016 Mid-Year Report


Second major version release.
Version 2.0
This version sought to make the tool more user friendly. On all fronts user-facing, it was very much a first pass, intended to pur meat on the bone of the application and provide an interface that user could react towards. Providing the foundation for future conversation and iteration proved invaluable in bringing in new interest to the tool and developing champions with various departments who encouraged coworkers to also opt into the application.

Updated user interface included segmentation of application functions and tiered access to organization overview data.
Learning
Will they use it? What features should we prioritize? Questions that underpinned the development of the second major version release of ClientComm hinged on understanding and prioritizing feature roll out. Every feature, from even the simplest client edit view, was validated and prioritized based on client need. This helped us deliver the most critical aspects of the tool first, thus keep just a few steps ahead of user demand while maintaining momentum.
Building
Initial visual interface. Unknown numbers captured. Features naturally needed to be made accessible by the users and thus a simple graphic user interface was built out. This provides something to the case managers with which they could respond to, indicating whether they liked something or did not like something. By having that as a basis for conversation, we facilitated the constructive feedback that led to the development of the workflow of the third version of ClientComm.
Measuring
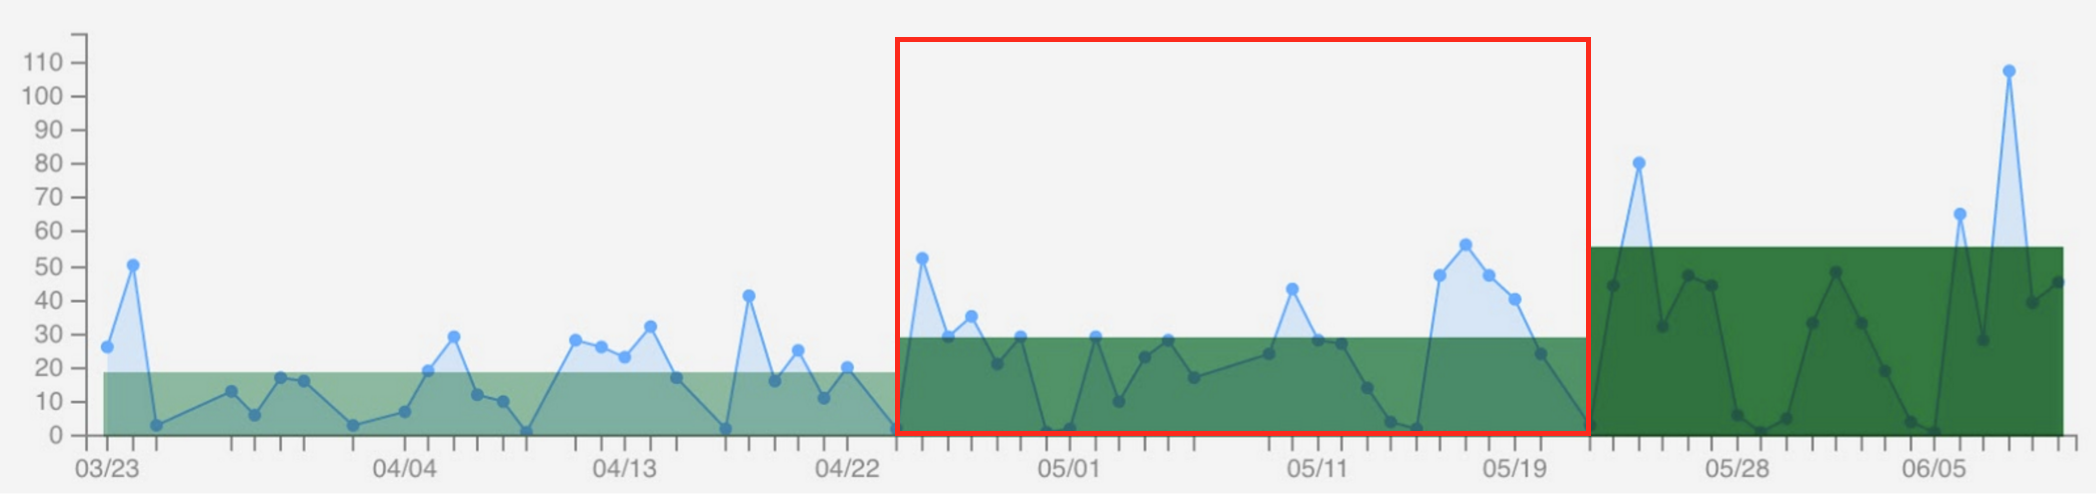
Monitoring Usage. Responding to feature requests from case managers through email. The inclusion of datetime values for every new component and user account that was created allowed for a database-facing method of measuring activity. Every action, every update, and every delete was logged in the database. Thus, the database schema was designed to monitor all interaction with the database. Because monitoring was focused on the database, the "front end" or user-facing portion of the application remained flexible. As we were able to observe what actions were most popular and what actions were less popular, we were able to correlate those metrics against user interviews and observed use sessions.
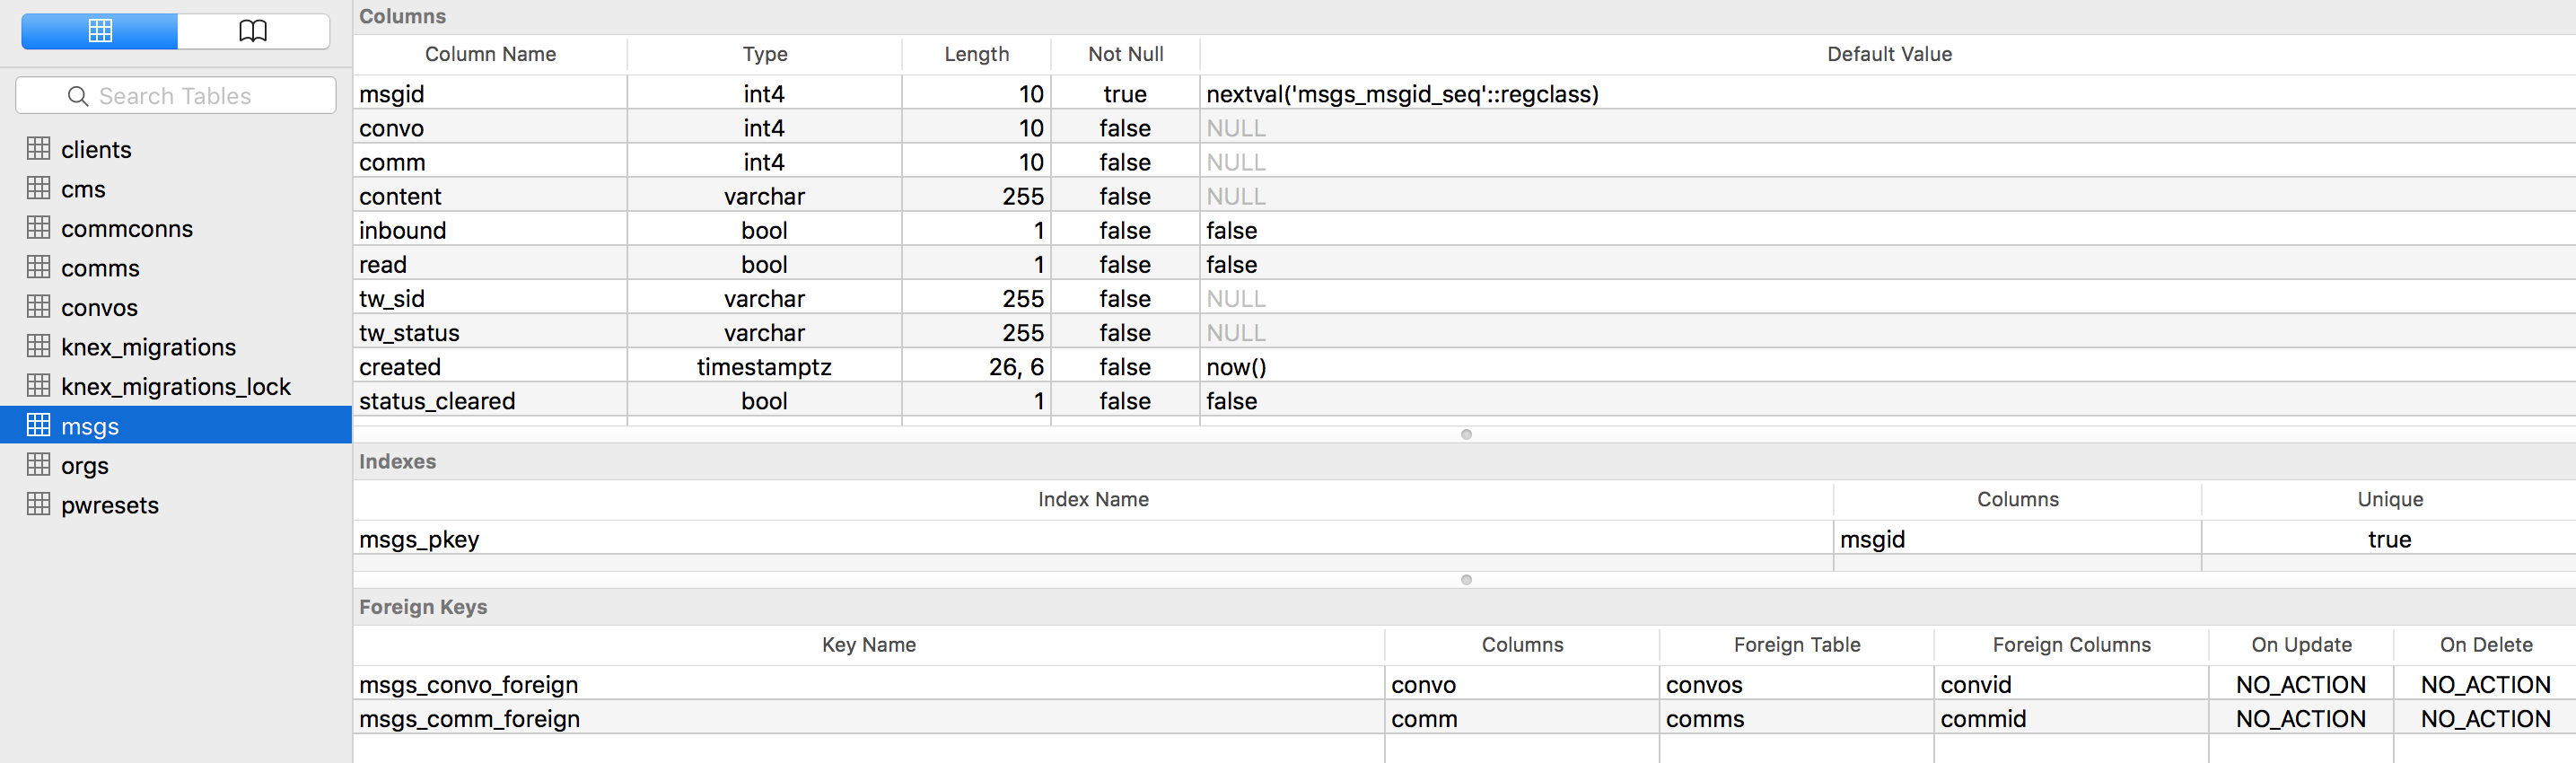
Above screen capture shows how a graphical user interface (GUI) was used to enable querying for monitoring ClientComm use be interacting directly with the database.